







Do the Angiographically-Derived FFR Systems Have a Class Effect?
© 2026 HMP Global. All Rights Reserved.
Any views and opinions expressed are those of the author(s) and/or participants and do not necessarily reflect the views, policy, or position of Cath Lab Digest or HMP Global, their employees, and affiliates.
Morton Kern, MD, MSCAI, FACC, FAHA,1 and Arnold H. Seto, MD, MPA, FACC, FSCAI2
1Clinical Editor; Interventional Cardiologist, Long Beach VA Medical Center, Long Beach, California; Professor of Medicine, University of California, Irvine Medical Center, Orange, California
2Dr. Seto is past Chief of Cardiology at Long Beach VA Medical Center, Professor of Medicine at Charles R Drew University, and Treasurer and Advocacy Chair of SCAI.

Disclosures: Dr. Morton Kern reports he is a consultant for Abiomed, Abbott Vascular, Philips, ACIST Medical, and Opsens Inc.
Dr. Kern can be contacted at mortonkern2007@gmail.com
On X @MortonKern
Dr. Seto can be contacted at arnold.seto@va.gov
Editor's Note: To view the article PDF, click the red PDF icon to the right of the article title.

Cath labs across the country are now using angiographically-based physiology systems to derive fractional flow reserve (FFR) without need for a wire or adenosine. Given the low use and perceived challenges to wire-based FFR, these systems are a welcome reality. Angiographically-derived physiology (ADP) is proposed to reduce procedure time, radiation, and cost, while improving procedure safety (recall there is no need for an intracoronary guidewire or adenosine) and maintaining strong diagnostic performance. After attending discussions of the various systems at the recent Society for Cardiovascular Angiography and Interventions meeting in Montreal, I thought this would be a good time to address a question that’s frequently asked: Are these systems all the same?
Before addressing the question, let’s look at what angiographically-derived physiology (ADP) provides.
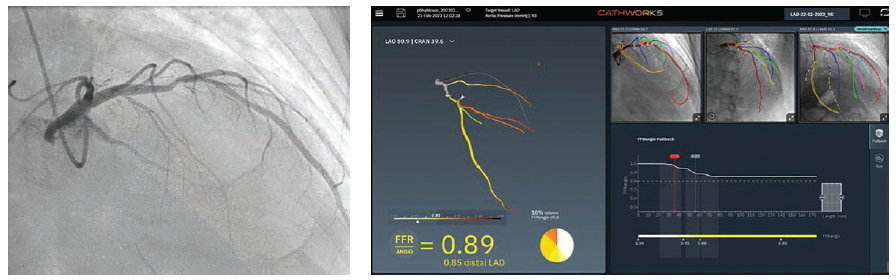
A 72-year-old man with chest discomfort and an equivocal exercise tolerance test comes to the cath lab. The left anterior descending (LAD) coronary artery has an intermediate 50-70% narrowing (Figure 1). A pressure wire FFR was 0.88, a non-ischemic value. For our own comparison, we also performed an online FFRangio (CathWorks, now Medtronic), which demonstrated an angiographically- derived FFR of 0.89. After using the FFRangio system for several years, we have good confidence that it can provide an accurate FFR in most circumstances. Questions about accuracy of ADP for complex anatomy (left main, bifurcations, grafts) are still under investigation.
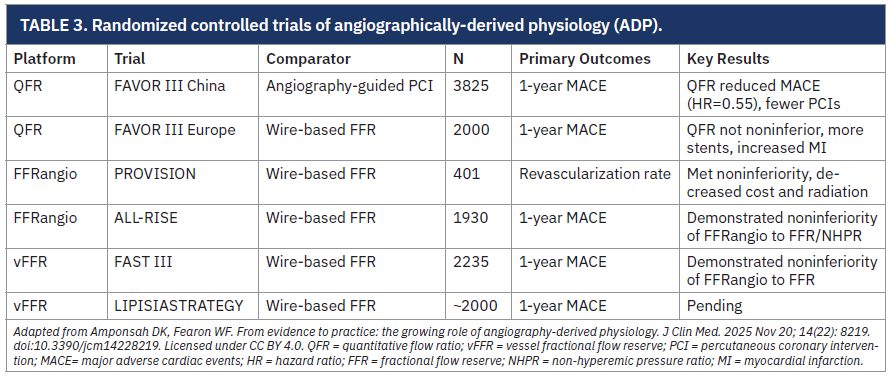
The Medtronic system is one of several commercially available ADP systems.1-3 After a decade of validation and clinical studies, adoption is increasing, particularly after the recent completion of several large randomized clinical trials.4,5 Each system generates an angiography-derived FFR value designed to approximate invasive wire-based FFR. The systems are distinguished by proprietary algorithms, different coronary and microvascular resistance assumptions, workflow (i.e., number of angiographic views needed), and operator interactions (number of screen clicks) to get to the FFR answer. Faria et al3 examined the differences among the systems such as the need for arterial pressure input, impact of coronary microvascular disease, contribution of side branches, and quality and quantity of current clinical data (Figure 2). At this point, any differences among results from different ADP systems have not been fully quantified.
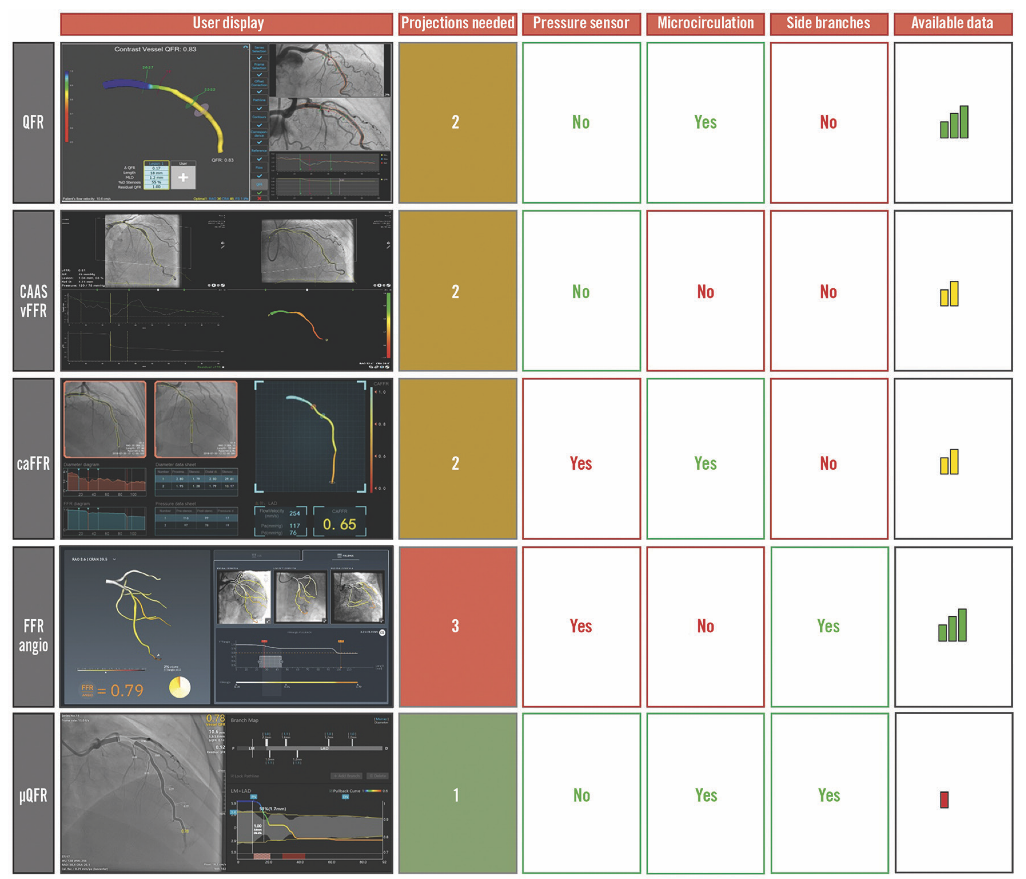
Adapted with permission from Faria D, Hennessey B, Shabbir A, et al. Functional coronary angiography for the assessment of the epicardial vessels and the microcirculation. EuroIntervention. 2023 Jun 19; 19(3): 203-221. doi:10.4244/EIJ-D-22-00969.
How is Angiographically-Derived Physiology (ADP) Generated?
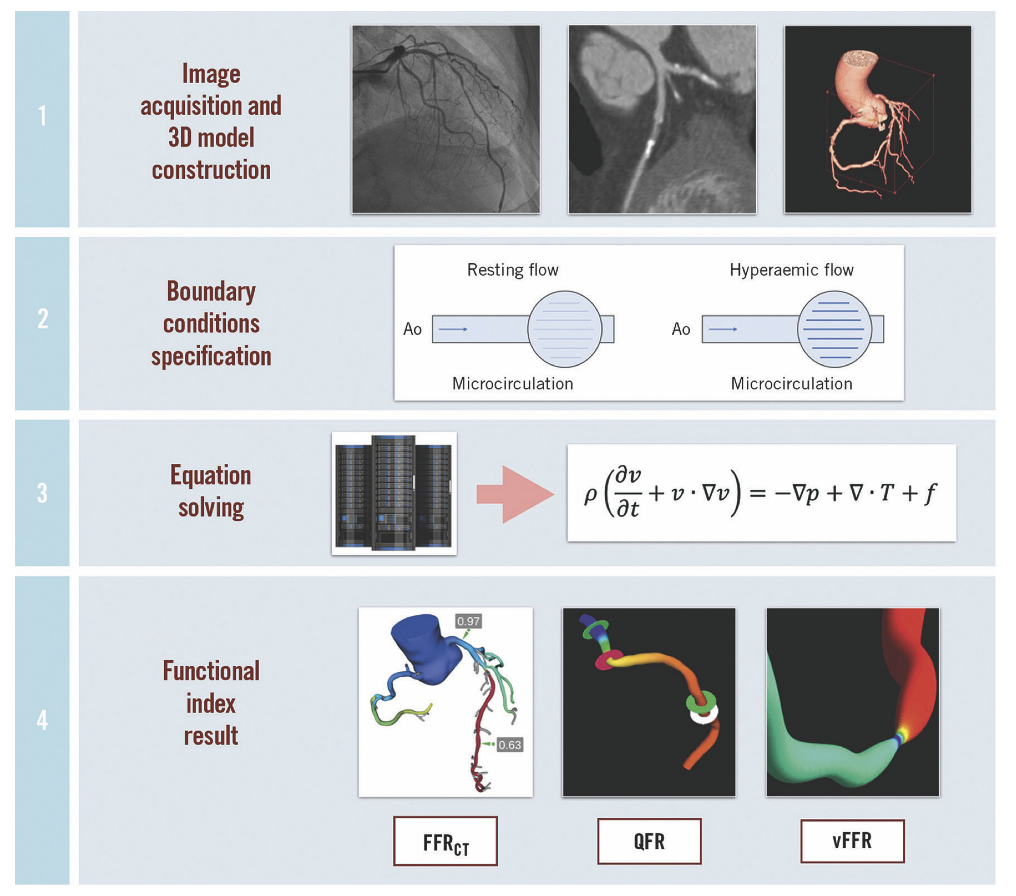
Since all angio FFR systems produce a similar result, given the potential limitations and differences, are they comparable enough to consider them as having a class effect? Before we can answer the question fully, it is important to understand how ADP is produced. Let’s review the steps needed to generate a functional angiographic image (Figure 3).
Reprinted with permission from Faria D, Hennessey B, Shabbir A, et al. Functional coronary angiography for the assessment of the epicardial vessels and the microcirculation. EuroIntervention. 2023 Jun 19; 19(3): 203-221. doi:10.4244/EIJ-D-22-00969.
Step 1. A standard coronary angiography is performed and analyzed, creating a three-dimensional anatomic model.
Step 2. Using the system’s physiologic model, the mathematical formulas (Navier-Stokes equations, resistance equations, and some other simplified flow calculations) are applied using predetermined boundary conditions (either assumed or measured) of pressure and flow.
Step 3. The computer then solves the equations for flow (at rest and during an assumed hyperemia state) and computes the FFR along the vessel.
Step 4. Functional indices (FFRangio, quantitative flow ratio [QFR], vessel FFR [vFFR], etc.), are then displayed on the monitor.
It should be noted that significant and operationally meaningful differences in cath lab workflow predominantly involve image‑ acquisition requirements (time, training and angiographic quality).
Validation and Clinical Data
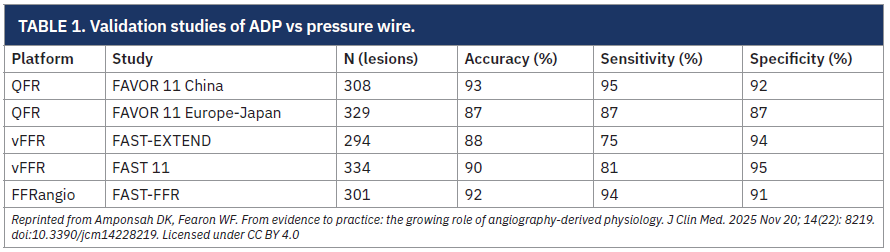
The validation studies show strong correlation and diagnostic accuracy for angio FFR vs wire FFR, typically with the area under the curve (AUC) in the 0.90–0.97 range in early single‑system trials. The studies show similar diagnostic performances compared to wire‑based FFR, with only modest differences in accuracy and sensitivity (Table 1).
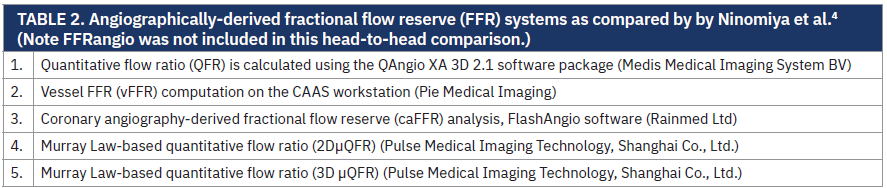
An anonymous comparison of various angiography‑derived FFR software was reported by Ninomiya et al.6 The study was a prospective, head‑to‑head comparison of 5 ADP methods vs pressure-wire FFR/instantaneous wave-free ratio (iFR) and retrospectively reviewed 390 angiograms with each system analyzed by 4 blinded reviewers (Table 2; note FFRangio was not included in this head-to-head comparison).
A core lab provided identical angiographic views and frame selection to each vendor, with blinded, anonymized analysis. Comparing the 5 angiography-derived FFR systems with invasive FFR and 2D QCA (% diameter stenosis), Ninomiya et al found the following:
1. High analyzability across systems (92–100% of vessels);
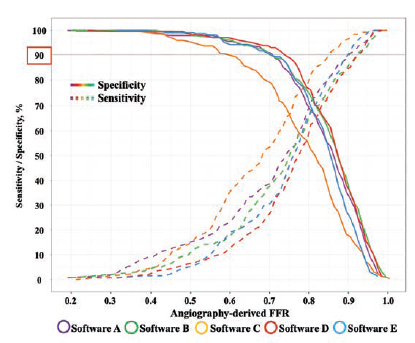
2. For prediction of invasive FFR ≤0.80, area under the curve (AUC) values were 0.75, 0.74, 0.74, 0.73, and 0.73 for the five angiography-derived FFR systems, compared with 0.65 for QCA (Figure 4).
3. Differences between systems were small and not clinically meaningful. All outperformed pure angiographic stenosis assessment and all fell short of prior validation data with their initially published results. Overall, these data suggest there is a class effect when tested under identical conditions, without identifying a single standout technology.
Reprinted with permission from Ninomiya K, Serruys PW, Kotoku N, et al. Anonymous comparison of various angiography-derived fractional flow reserve software with pressure-derived physiological assessment. JACC Cardiovasc Interv. 2023 Jul 24; 16(14): 1778-1790. doi:10.1016/j.jcin.2023.04.026.
Across the broader ADP literature, QFR and FFRangio currently have the most randomized and multicenter data, while some newer platforms such as caFFR and AccuFFR have smaller or more regional datasets. QFR has the largest number of studies and several randomized trials, with QFR‑guided percutaneous coronary intervention (PCI) showing better outcomes vs angiography‑only guidance,7 but QFR‑guided PCI failed a non‑inferiority trial vs wire FFR8.
ADP Workflow
ADP systems differ in the number and angle of required projections, tolerance for angiographic artifacts, such as vessel overlap and foreshortening, need for manual contouring vs automation, time of signal acquisition, and ease of use (fewer clicks). It is likely these differences could translate into a superior platform and better real‑world success. Those systems with the lowest additional lab workflow impingement may be preferred, having similar underlying physiologic results and clinical outcomes.
The Bottom Line
Commercially available ADP platforms are FDA approved with features and limitations that distinguish one vendor system over another.9 Despite what appears to be a marked step forward toward ease of use with very good diagnostic accuracy, there is reticence among operators to adopt the technology. Barriers to adoption include perceived limited large clinical outcome evidence, lack of reimbursement, training requirements and change in operator angiographic techniques, cath lab workflow integration, and operator–machine interaction requirements (Figure 5). Updated guidelines on the use of ADP will likely follow as more clinical studies become available.
To the main question, are these systems similar enough to have a class effect? In our view, the answer is ‘yes’ for determination of an accurate FFR value and ‘no’ regarding the available clinical outcome studies and cath lab workflow. The answer will become clearer as the industry and interventionists use these tools to discover new applications for better results for our patients.
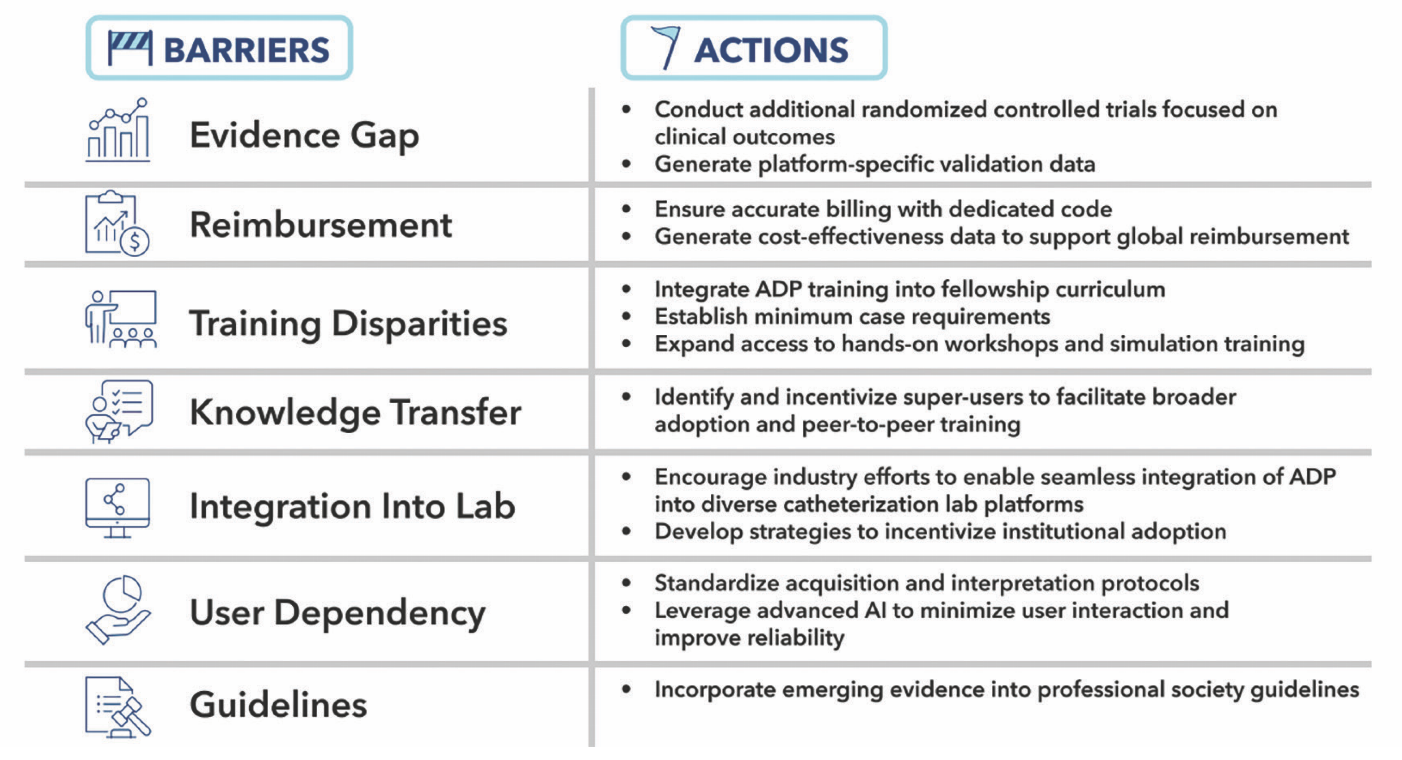
Reprinted with permission from Shlofmitz E, Shin D, Alasnag M, Al-Azizi K, Ali ZA, Bangalore S, Collet C, Escaned J, Gonzalo N, Jeremias A, Kaki A, Kern MJ, et al. Angiography-derived physiology for coronary artery disease assessment: expert opinion from a SCAI roundtable. J Soc Cardiovasc Angiogr Interv. 2026 Feb 3; 5(3): 104156. doi:10.1016/j.jscai.2025.104156
References
1. Shlofmitz E, Shin D, Alasnag M, Al-Azizi K, Ali ZA, Bangalore S, Collet C, Escaned J, Gonzalo N, Jeremias A, Kaki A, Kern MJ, et al. Angiography-derived physiology for coronary artery disease assessment: expert opinion from a SCAI roundtable. J Soc Cardiovasc Angiogr Interv. 2026 Feb 3; 5(3): 104156. doi:10.1016/j.jscai.2025.104156
2. Strepkos D, Sara JDS, Carvalho PEP, Alexandrou M, Mutlu D, Ser OS, Seto AH, et al. Angiography-derived fractional flow reserve: newer data and future directions. Am J Cardiol. 2025 Mar 1; 238: 1-8. doi:10.1016/j.amjcard.2024.11.021.
3. Faria D, Hennessey B, Shabbir A, et al. Functional coronary angiography for the assessment of the epicardial vessels and the microcirculation. EuroIntervention. 2023 Jun 19; 19(3): 203-221. doi:10.4244/EIJ-D-22-00969.
4. Fearon WF, Jeremias A, Witberg G, et al; ALL-RISE Investigators. Angiography-derived fractional flow reserve to guide PCI. N Engl J Med. 2026 Mar 29. doi:10.1056/NEJMoa2600949. Epub ahead of print.
5. Daemen J, van der Eijk JA, Barbierato M, et al; FAST III Investigators. Angiography-based physiology to guide coronary revascularization. N Engl J Med. 2026 Mar 29. doi:10.1056/NEJMoa2601841. Epub ahead of print.
6. Ninomiya K, Serruys PW, Kotoku N, et al. Anonymous comparison of various angiography-derived fractional flow reserve software with pressure-derived physiological assessment. JACC Cardiovasc Interv. 2023 Jul 24; 16(14): 1778-1790. doi:10.1016/j.jcin.2023.04.026.
7. Xu B, Tu S, Song L, et al; FAVOR III China study group. Angiographic quantitative flow ratio-guided coronary intervention (FAVOR III China): a multicentre, randomised, sham-controlled trial. Lancet. 2021 Dec 11; 398(10317): 2149-2159. doi:10.1016/S0140-6736(21)02248-0
8. Andersen BK, Sejr-Hansen M, Maillard L, et al. Quantitative flow ratio versus fractional flow reserve for coronary revascularisation guidance (FAVOR III Europe): a multicentre, randomised, non-inferiority trial. Lancet. 2024 Nov 9; 404(10465): 1835-1846. doi:10.1016/S0140-6736(24)02175-5.
9. Amponsah DK, Fearon WF. From evidence to practice: the growing role of angiography-derived physiology. J Clin Med. 2025 Nov 20; 14(22): 8219. doi:10.3390/jcm14228219