

Opioid Prescription Patterns in Hand Surgery: A Medicare Part D Analysis
© 2025 HMP Global. All Rights Reserved.
Any views and opinions expressed are those of the author(s) and/or participants and do not necessarily reflect the views, policy, or position of ePlasty or HMP Global, their employees, and affiliates.
Abstract
Background. The opioid crisis continues to be a significant public health concern in the United States, with postoperative prescriptions contributing to the problem. Older adults face increased risks from opioid use, yet prescribing practices for hand surgery in the Medicare population remain understudied. This research aims to elucidate opioid prescription patterns among hand surgeons treating Medicare patients, focusing on national trends, regional variations, and gender differences.
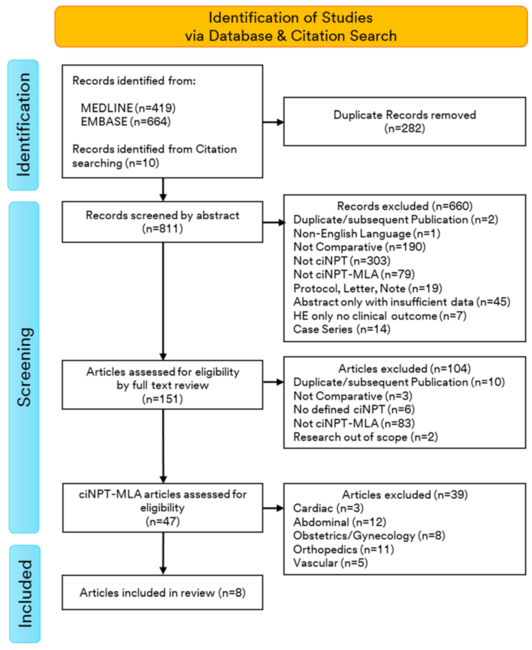
Methods. A retrospective analysis was conducted using data from the Centers for Medicare and Medicaid Services Medicare Part D Prescription Drug Program Prescribers Public Use File for hand surgeons from 2015 to 2019. National trends, regional variations based on US Census Bureau divisions, state-level differences, and gender disparities in opioid prescribing patterns were examined. Key metrics included opioid prescribing rates, proportion of opioid claims to total claims, average prescription duration, and total opioid claims per surgeon.
Results. From 2015 to 2019, a total of 1752 hand surgeons were identified in the Medicare Part D database with a 5-year average of 231 405 opioid claims, comprising 53% of all claims made by hand surgeons. The median opioid prescribing rate decreased from 61.4% in 2015 to 55.3% in 2019. The proportion of opioid claims to total claims fell from 55.4% to 48.27%, and the average prescription duration decreased from 6.3 to 4.67 days. Significant regional and state-level variation was identified. Overall, the South had higher numbers of opioid prescriptions per hand surgeon and prescribed for more days compared with all other regions, but the Midwest and West regions had larger proportions of opioid claims.
Conclusions: Despite an overall decrease in opioid prescribing by hand surgeons for Medicare patients from 2015 to 2019, significant regional and gender-based variations persist. These findings underscore the need for standardized guidelines, improved prescriber education, and better integration of monitoring programs.
Introduction
After a 17-year progressive increase in prescription opioid deaths in the United States, the US Department of Human and Health Services (HHS) declared the opioid crisis to be a public health emergency in 2017. The number of prescription opioid-related deaths decreased from 2017 to 2019 but rose up again by 16% in parallel with the COVID pandemic in 2020. The opioid crisis is complex and stems from many factors, including both increases in prescriptions as well as accessibility to heroin and synthetic drugs. Frank misuse of prescription opioids continues to be a significant factor driving the epidemic, with over 10 million people shown to have misused prescription opioids and 1.6 million people misusing prescription opioids for the first time in 2019.2
The surgical patient in acute pain presents a unique challenge in regard to overall opioid misuse. Research suggests that over 70% of post-procedure opioid prescriptions remain unused, highlighting the importance of prescribing habits.3 General surgeons have been found to contribute over 36% of all opioid prescriptions, with other surgical subspecialties such as otolaryngology, urology, and ophthalmology contributing 4% to 17%.4-7 Within hand surgery, upwards of 13% of opioid-naive patients continue to fill their prescriptions beyond 90 days of their procedure, despite otherwise needing minimal pain management.8 Non-inferiority trials have shown pain outcomes and associated complication rates with the use of over-the-counter medications vs opioids to be similar; however, postoperative complication rates are higher with opioid use.9,10
Medicare is the national health insurance program in the United States that provides coverage for over 60 million Americans aged 65 years and older as well as younger people with disabilities. Despite evidence showing older adults are at higher risk of harm from opioids, there is a gap in evidence on hand surgery-associated opioid prescription patterns specifically within this Medicare population.11 Other studies have indicated large, practice-level variations in prescription habits, with roughly half of carpal tunnel release (CTR) patients receiving postoperative opioids.12 However, uncertainty remains regarding the relationship between postoperative opioid use and older adults undergoing a wide variety of procedures delivered by hand surgeons. Currently, there are unclear national or regional recommendations for opioid prescription in the setting of CTR and hand surgeries in general, and providers often follow institution-based practices. As such, this project set out to describe the longitudinal and geographic trends of opioid prescription habits of hand surgeons in the postoperative Medicare population.
Methods and Materials
Data collection
The Centers for Medicare and Medicaid Services Medicare Part D Prescription Drug Program Prescribers Public Use File (PUF) was used to extract state, local, and individual provider-level prescription data for the years 2015 to 2019. The PUF contains information pertaining to 70% of the drugs prescribed by providers to Medicare beneficiaries paid for by the Medicare Part D Prescription Drug Program. The prescriber type was limited to providers identified as hand surgeons who practiced in the continental United States. Furthermore, prescribers who wrote 10 or fewer opioid prescriptions to Medicare Part D beneficiaries within a given calendar year were excluded from the database.
The variables extracted and used included the National Provider Identifier (NPI), provider gender, state of practice, year, total prescription claim count, total prescription claim cost, opioid claim count, opioid drug cost, and beneficiary count (per state). Total prescription claims include both the initial prescription and refills.
Geographic and provider-level analysis
To evaluate regional and state-level trends, we organized states into regions according to the US Census Bureau’s 2010 Census Regions and Divisions.13 Total opioid claim counts were aggregated between 2015 and 2019 within each state, and then within each regional division. Opioid claim counts were also aggregated within the 5-year period of analysis (2015-2019) based on unique NPI. The percentage of opioid claims was calculated as the proportion of opioid claims to the total prescription claims. The gender of each hand surgeon was also extracted from the data and evaluated based on prescribing patterns. In addition, the length of prescription was defined as an aggregate number of days’ supply of opioids. The average number of days per prescription was then stratified by year, prescriber gender, and prescriber region, which allowed for the creation of a density heat map averaged over 5 years. The median prescribing rate was defined as the total number of prescriptions and refills provided per surgeon.
Statistical analysis
Descriptive statistical analysis was conducted to present counts and percentages for categorical variables and means and SDs for continuous variables. Statistical significance was predetermined for any P-value less than .05. Microsoft Excel (Microsoft Corp) was used to organize the PUF. All other analyses were performed using RStudio R version 4.1.1 (R, Foundations for Computational Statistics). This study was exempt by UNC-Chapel Hill Institutional Review Board as it did not constitute human subjects research as defined under federal regulations [45 CFR 46.102 (e or l) and 21 CFR 56.102(c)(e)(l)].
Results
National trends
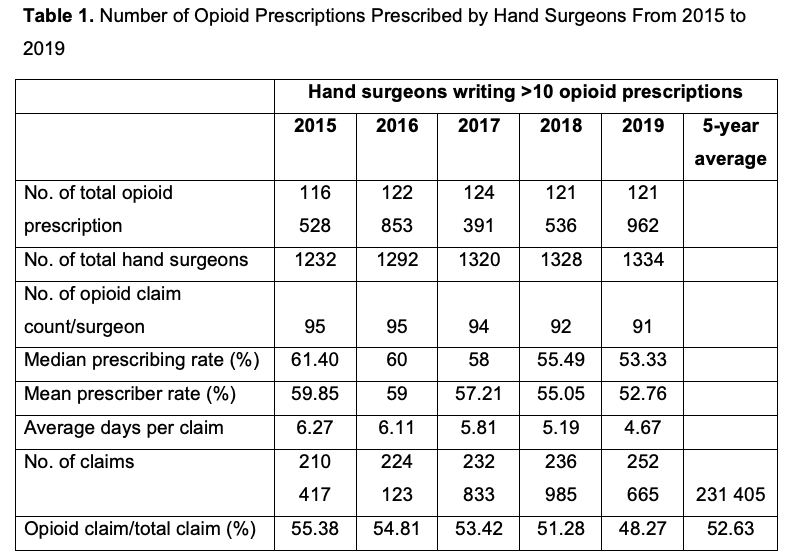
A total of 1752 hand surgeons were identified in the Medicare Part D database from 2015 to 2019. In this time, the total number of opioid prescriptions among hand surgeons peaked in 2017 and decreased in the subsequent 2 years (Table 1). Though the total number of prescriptions increased from 2015 to 2019, the median prescribing rate (2015: 61.4%; 2016: 60%; 2017: 58%; 2018: 55.5%; 2019: 55.3%), percentage of opioid claims (2015: 55.4%; 2016: 54.8%; 2017: 53.4%; 2018: 51.3%; 2019: 48.27%), and average days per claim (2015: 6.3; 2016: 6.1, 2017: 5.8; 2018: 5.2 2019: 4.67) decreased every year.
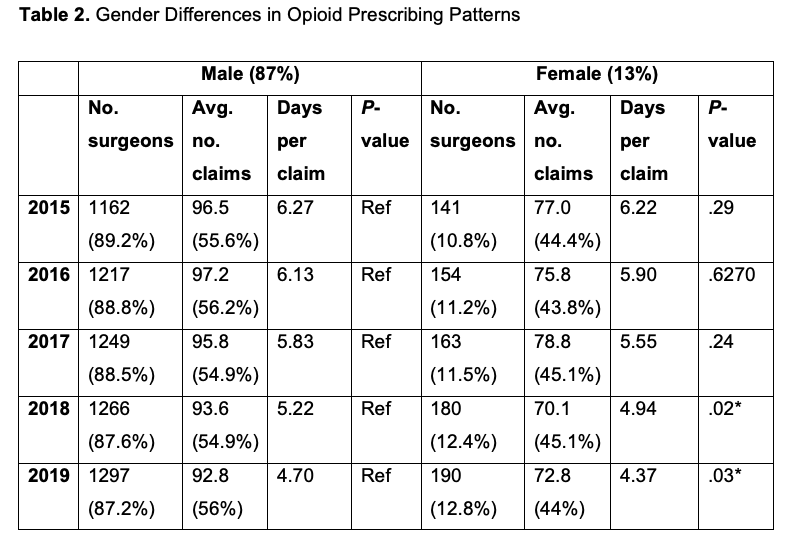
Averaged across 5 years, 88.2% and 11.74% of the total hand surgeons were male and female, respectively. Male hand surgeons had higher average opioid prescription claims than female hand surgeons every year between 2015 and 2019. In both 2018 and 2019, male surgeons wrote opioid prescriptions for more days as compared with their female counterparts (P = .02, P = .03; Table 2).
Regional trends
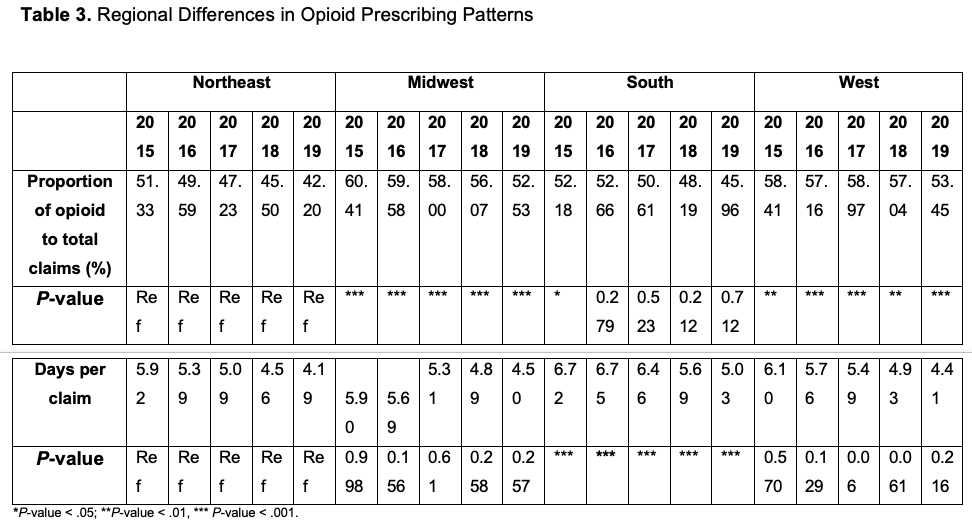
When divided into 4 geographic regions, the Northeast had a lower proportion of total opioid prescriptions as compared with the Midwest and the West (Table 3). The South and Northeast had similar proportions of total opioid prescriptions; however, prescriptions by hand surgeons in the South were significantly longer in duration for every year (6.13 days vs 5.03 days; P < .001). After 2017, the West, Midwest, and Northeast averaged under 5 days per opioid prescription, whereas the South remained above 5 days through 2019 (South: 5.03 days; Northeast: 4.19 days; Midwest: 4.50 days; West: 4.41 days).
In addition to the proportion of opioid prescriptions and length of prescription, the average number of opioid prescriptions per hand surgeon also varied widely by region (Table 4). Nationally, the average number of opioid claims per provider between 2015 and 2019 was 330 (SD 149). Overall, the Northeast had the lowest average of opioid claims per surgeon (218), followed by the West (258), the Midwest (375), and the South (453). Further stratification by the 9 US census regions demonstrated the lowest number of opioid claims per provider in the New England region (191) and the highest average in the East South-Central region (518). A geographic distribution of opioid claims per hand surgeon for all states can be seen in Figure 1. The geographical trend of the proportion of opioid claims to total claims differed, with the highest in the Midwest (58%) and West (57%) and the lowest in the Northeast (49%) and South (50%) (Table 4).
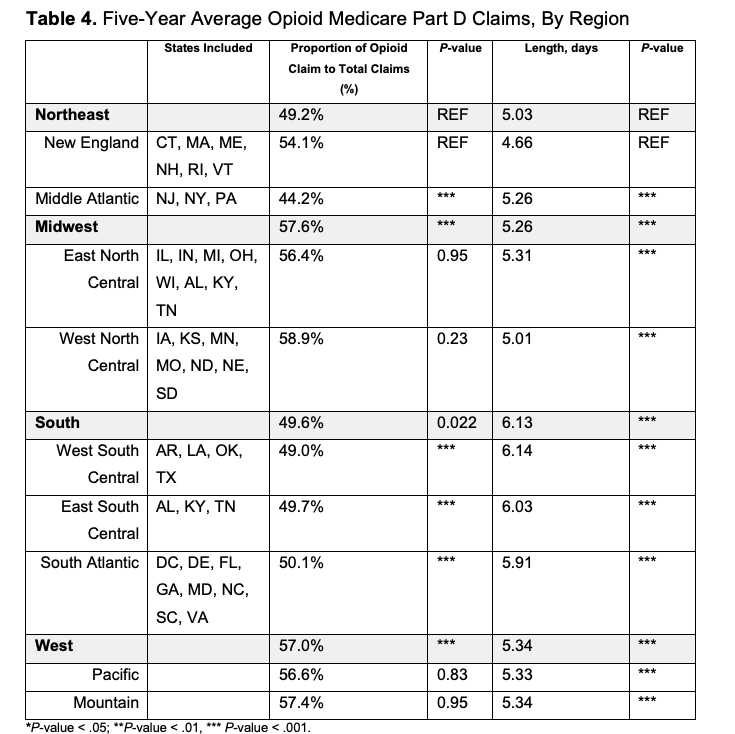
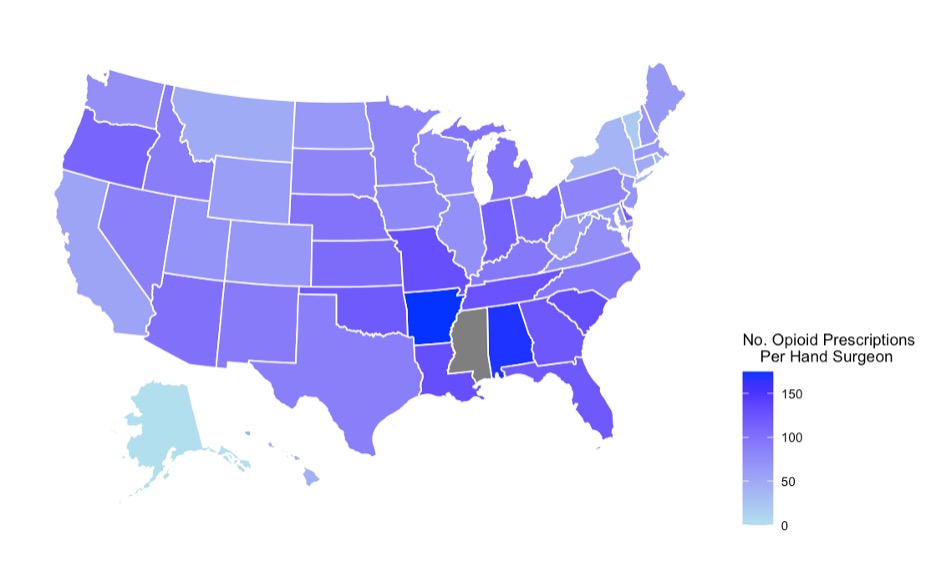
Figure 1. Geographic distribution of opioid prescriptions prescribed per hand surgeon from 2015 to 2019.
The 9 US Census regions were trended longitudinally, and opioid claims were compared to the entire opioid claim burden by hand surgeons in the nation (Figures 2 and 3). While most regions had similar or decreased proportions from 2015 to 2019, the West South-Central region showed an increase in the proportion of opioid claims (Figures 2 and 3).
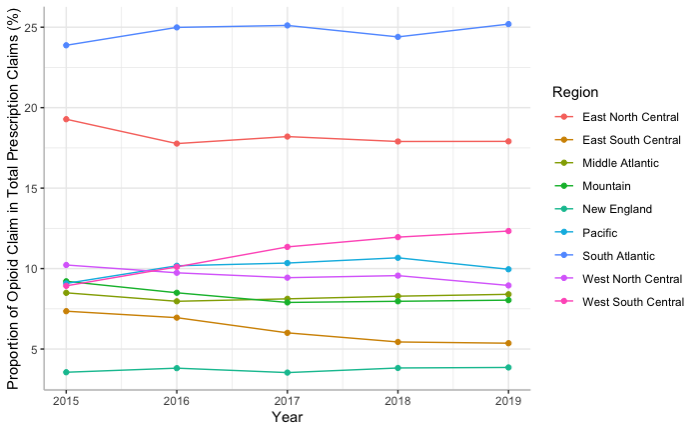
Figure 2. Five-year proportion of opioid claims to total opioid claim count, by state.
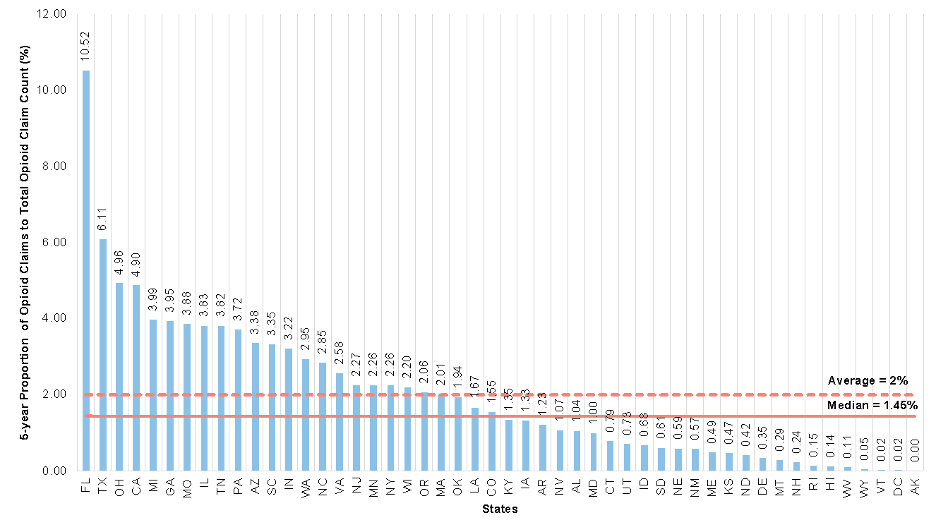
Figure 3. Annual proportion of opioid claims, stratified by US regions.
Discussion
There has been a tremendous focus on research and policy changes since the HHS declared the opioid crisis to be a public health emergency. Surgeons play a unique role in prescription opioids by balancing the need to control postoperative pain effectively with patient safety. As the first nationwide analysis of opioid prescribing patterns among hand surgeons, this study shows that the median prescribing rate of hand surgeons and the proportion of opioid claims out of total claims decreased each year from 2015 to 2019, with the biggest decrease occurring from 2017 to 2019. However, there were significant regional and state-level variations in prescribing patterns, reflecting the need for more standardized guidelines and opportunities for practice change. To date, there is no definitive consensus delineating appropriate opioid prescription patterns in the Medicare hand surgery population. Most legislation regarding opioid prescribing patterns has been made at an institutional or state level, which has resulted in variability throughout the United States.14-17
Since Massachusetts first enacted legislation limiting the initial prescription of opioids for acute pain in 2016, 36 states followed suit. Some states have even placed limitations on the volume of pills or even indications for prescription but range on stipulations regarding days, insurance payers, and milligram equivalents. Many legislations were first in Northeastern states, with others passed in late 2017 through 2018. These variations in legislation may explain the trends noted in the current analysis by geographic region.
By the end of 2017, all 50 states joined the Prescription Drug Monitoring Program (PDMP) to allow physicians and pharmacists to track patient history of controlled substances. However, there have been mixed results on the effectiveness of the PDMP to reduce the number of prescriptions and overdoses.18 For example, despite all states being a part of the PDMP, only 23 states mandate all prescribers and dispensers enroll in the program.19 Furthermore, only 13 states require both prescribers and dispensers to check the PDMP before writing or filling a prescription, despite evidence suggesting a 10% reduction in opioid prescriptions in states participating fully in the PDMP.20 A large barrier to implementation is that PDMP is an independent program not well integrated with current electronic health record companies such as EPIC and failed to engage both patients and physicians. In contrast, states or institutions that use quality improvement frameworks that are patient-focused and physician-driven have found success in decreasing excessive opioid prescribing across multiple different surgical specialties without compromising patient satisfaction or pain control.21-24
One concern regarding the generation of opioid prescription guidelines for postoperative care is the wide variety of procedures and patient factors, necessitating individualized patient-centered care. As such, we believe prescribers must be the primary drivers of such initiatives, specifically within the field of hand surgery. The Michigan Surgical Quality Collaborative successfully developed prescribing guidelines for 32 different surgical procedures to decrease prescription size and opioid use while maintaining quality pain control outcomes.12 Other states could consider similar statewide hospital quality-improvement collaboratives and develop recommendations specific to their population, if necessary.
For surgical providers to be drivers and active participants in reducing patient opioid use, the problem and potential solutions must be built into educational programs. At this time, less than a third of surgical residency programs mandate opioid prescribing education, despite all programs allowing trainees to prescribe opioids.25 Thus, increasing the amount and quality of opioid prescription education for surgical trainees would likely benefit their future practices and patients alike.26,27
As a public health emergency, the opioid crisis should be addressed through a public health lens with evidence-based guidelines. From the provider level of opioid prescription awareness, hospital-level prescribing guidelines, state-level quality initiatives, and systems-level integration of the PDMP into the medical EMR, there are many avenues in which public policy and educational paradigms can make a difference. To help prioritize these strategies, future research focused on the causes of excess opioid prescribing and practice variation is needed.
Limitations
Several limitations of this study exist because of the dataset used, which only includes individuals older than 65 years. Although the elderly population is at higher risk from opioid toxicities, surgeons have been shown to be more cautious in this population.28,29 Thus, the actual prescribing patterns among all ages may be underrepresented. Another limitation of the dataset is the lack of individual-level information, which does not allow for our analyses to account for potential confounding factors such as specific dosage, preexisting chronic pain conditions, or medical comorbidities that would alter postoperative pain control. This also does not allow for sub-analyses by race to study disparities or for different hand procedures, as hand surgeries may range from acute trauma injuries to elective outpatient procedures. The study was also not able to account for the interregional variability of hand surgeons per capita or volume of surgical cases. Furthermore, we were unable to study specific prescribed-dose equivalents among prescriptions. However, Medicare Part D provides a strong dataset and is the largest single payer of opioid prescription coverage, thus allowing for the description of opioid use within the population of patients 65 years and older. While this dataset does include resident physicians, an additional limitation is that it does not include advanced practice providers.
Conclusions
This nationwide analysis of opioid prescribing patterns among hand surgeons treating Medicare beneficiaries from 2015 to 2019 reveals important trends in addressing the opioid crisis within postoperative pain management. We observed a consistent decrease in opioid prescribing rates, with significant reductions between 2017 and 2019. However, notable regional, state-level, and gender-based variations in prescribing patterns persist, highlighting the need for standardized guidelines. Our findings underscore the complex nature of opioid prescribing in hand surgery and the varied impact of state-level legislation and programs like the PDMP. To address these challenges, we propose developing evidence-based guidelines tailored to specific procedures and patient populations, implementing quality improvement frameworks, enhancing opioid prescription education in surgical residency programs, and improving the integration of prescription monitoring programs with electronic health records. By addressing these areas, we can work toward more consistent and appropriate opioid prescribing practices in hand surgery, balancing effective pain management with patient safety.
Acknowledgments
Authors: Sabrina M. Wang, MD, MPH1; Steven L. Zeng, BA1; Victoria Wu, BA2; Emmanuel O. Emovon III, BS1; J. Andres Hernandez, MD, MBA1; William M. Tian, BS1; Cynthia Feltner, MD, MPH3; Suhail K. Mithani, MD1
Affiliations: 1Division of Plastic, Reconstructive, Maxillofacial and Oral Surgery, Duke University Medical Center, Durham, NC; 2Case Western Reserve University School of Medicine, Cleveland, Ohio; 3Department of Medicine, University of North Carolina at Chapel Hill, Chapel Hill, North Carolina
Correspondence: Emmanuel O. Emovon III, BS, Duke University School of Medicine, 40 Duke Medicine Circle, Box 3945, Durham, NC 27710, USA. E-mail:
Ethics: This study was exempt by UNC-Chapel Hill Institutional Review Board as it did not constitute human subjects research as defined under federal regulations [45 CFR 46.102 (e or l) and 21 CFR 56.102(c)(e)(l)].
Disclosures: Dr Mithani serves as a consultant to Integra LifeSciences. The remaining authors disclose no financial or other conflicts of interest.
References
- Mattson CL, Tanz LJ, Quinn K, Kariisa M, Patel P, Davis NL. Trends and geographic patterns in drug and synthetic opioid overdose deaths - United States, 2013-2019. MMWR Morb Mortal Wkly Rep. 2021;70(6):202-207. doi:10.15585/mmwr.mm7006a4
- Substance Abuse and Mental Health Services Administration. Key substance use and mental health indicators in the United States: Results from the 2019 National Survey on Drug Use and Health. HHS Publication No. PEP20-07-01-001, NSDUH Series H-55. Rockville, MD: Center for Behavioral Health Statistics and Quality, Substance Abuse and Mental Health Services Administration; September 2020. Accessed June 13, 2022. https://www.samhsa.gov/data/data-we-collect/nsduh-national-survey-drug-use-and-health/national-releases/2019
- Hill MV, McMahon ML, Stucke RS, Barth RJ Jr. Wide Variation and excessive dosage of opioid prescriptions for common general surgical procedures. Ann Surg. 2017;265(4):709-714. doi:10.1097/SLA.0000000000001993
- Levy B, Paulozzi L, Mack KA, Jones CM. Trends in opioid analgesic-prescribing rates by specialty, U.S., 2007-2012. Am J Prev Med. 2015;49(3):409-413. doi:10.1016/j.amepre.2015.02.020
- Svider PF, Arianpour K, Guo E, et al. Opioid prescribing patterns among otolaryngologists: crucial insights among the Medicare population. Laryngoscope. 2018;128(7):1576-1581. doi:10.1002/lary.27101
- Callegari M, Jella T, Mahran A, et al. Opioid prescription patterns among urologists as compiled from within Medicare. Can Urol Assoc J. 2021;15(11):E574-E581. doi:10.5489/cuaj.7086
- Charlson ES, Feng PW, Bui A, Grob S, Tao JP. Opioid prescribing patterns among American Society of Ophthalmic Plastic and Reconstructive surgery members in the Medicare Part D database. Ophthalmic Plast Reconstr Surg. 2019;35(4):360-364. doi:10.1097/IOP.0000000000001266
- Johnson SP, Chung KC, Zhong L, et al. Risk of prolonged opioid use among opioid-naïve patients following common hand surgery procedures. J Hand Surg Am. 2016;41(10):947-957.e3. doi:10.1016/j.jhsa.2016.07.113
- Lalonde DH, Lalonde JF, MacDermid JC, et al. Time to stop routinely prescribing opiates after carpal tunnel release. Plast Reconstr Surg. 2022;149(3):651-660. doi: 10.1097/PRS.0000000000008834
- Gause TM II, Nunnery JJ, Chhabra AB, Werner BC. Perioperative narcotic use and carpal tunnel release: trends, risk factors, and complications. Hand (N Y). 2020;15(2):234-242. doi:10.1177/1558944718792276
- Maree RD, Marcum ZA, Saghafi E, Weiner DK, Karp JF. A systematic review of opioid and benzodiazepine misuse in older adults. Am J Geriatr Psychiatry. 2016;24(11):949-963. doi:10.1016/j.jagp.2016.06.003
- Billig JI, Kotsis SV, Chung KC; Michigan Collaborative Hand Initiative for Quality in Surgery Collaborators. Opioid prescribing after carpal tunnel release: analysis from the Michigan Collaborative Hand Initiative for Quality in Surgery. Plast Reconstr Surg. 2021;148(5):1064-1072. doi:10.1097/PRS.0000000000008421
- 2010 Census Regions and Divisions of the United States. United States Census Bureau. Updated October 8, 2021. Accessed June 4, 2022. https://www.census.gov/geographies/reference-maps/2010/geo/2010-census-regions-and-divisions-of-the-united-states.html
- Dowell D, Zhang K, Noonan RK, Hockenberry JM. Mandatory provider review and pain clinic laws reduce the amounts of opioids prescribed and overdose death rates. Health Aff (Millwood). 2016;35(10):1876-1883. doi:10.1377/hlthaff.2016.0448
- Duensing K, Twillman R, Ziegler S, et al. An examination of state and federal opioid analgesic and continuing education policies: 2016-2018. J Pain Res. 2020;13:2431-2442. doi:10.2147/JPR.S267448
- Buffington DE, Lozicki A, Alfieri T, Bond TC. Understanding factors that contribute to the disposal of unused opioid medication. J Pain Res. 2019;12:725-732. doi:10.2147/JPR.S171742
- Parker AM, Strunk D, Fiellin DA. State responses to the opioid crisis. J Law Med Ethics. 2018;46(2):367-381. doi:10.1177/1073110518782946
- Finley EP, Garcia A, Rosen K, McGeary D, Pugh MJ, Potter JS. Evaluating the impact of prescription drug monitoring program implementation: a scoping review. BMC Health Serv Res. 2017;17(1):420. doi:10.1186/s12913-017-2354-5
- Mandated Enrollment and Usage. PDMP TTAC. Accessed June 14, 2022. https://www.pdmpassist.org/Policies/Enrollment
- Wen H, Schackman BR, Aden B, Bao Y. States with prescription drug monitoring mandates saw a reduction in opioids prescribed to Medicaid enrollees. Health Aff (Millwood). 2017;36(4):733-741. doi:10.1377/hlthaff.2016.1141
- Howard R, Waljee J, Brummett C, Englesbe M, Lee J. Reduction in opioid prescribing through evidence-based prescribing guidelines. JAMA Surg. 2018;153(3):285-287. doi:10.1001/jamasurg.2017.4436
- Hill MV, Stucke RS, McMahon ML, Beeman JL, Barth RJ. An educational intervention decreases opioid prescribing after general surgical operations. Ann Surg. 2018;267(3):468-472. doi:10.1097/SLA.0000000000002198
- Lee JS, Howard RA, Klueh MP, et al. The impact of education and prescribing guidelines on opioid prescribing for breast and melanoma procedures. Ann Surg Oncol. 2019;26(1):17-24. doi:10.1245/s10434-018-6772-3
- Saini S, McDonald EL, Shakked R, et al. Prospective evaluation of utilization patterns and prescribing guidelines of opioid consumption following orthopedic foot and ankle surgery. Foot Ankle Int. 2018;39(11):1257-1265. doi:10.1177/1071100718790243
- Yorkgitis BK, Bryant E, Raygor D, Brat G, Smink DS, Crandall M. Opioid prescribing education in surgical residencies: a program director survey. J Surg Educ. 2018;75(3):552-556. doi:10.1016/j.jsurg.2017.08.023
- Arora NS, Marcotte KM, Hopper JA. Reducing opioid misuse among adolescents through physician education. Subst Abus. 2018;39(1):6-8. doi:10.1080/08897077.2017.1356788
- Chiu AS, Healy JM, DeWane MP, Longo WE, Yoo PS. Trainees as agents of change in the opioid epidemic: optimizing the opioid prescription practices of surgical residents. J Surg Educ. 2018;75(1):65-71. doi:10.1016/j.jsurg.2017.06.020
- Shah R, Raji MA, Westra J, Kuo Y-F. Association of co-prescribing of opioid and benzodiazepine substitutes with incident falls and fractures among older adults: a cohort study. BMJ Open. 2021;11(12):e052057. doi:10.1136/bmjopen-2021-052057
- Ayoub NM, Jibreel M, Nuseir K, Al-Taani GM. A survey of knowledge and barriers of healthcare professionals toward opioid analgesics in cancer pain management. Int J Clin Pract. 2022;2022:1136430. doi:10.1155/2022/1136430